Skip navigation

I was inspired by a similar game that Steve Willoughby or maybe SRA Real Math contained about fractions. If anyone can track down a link to that, let me know!

This game is played on a board with some number of bars of length 2, with the middle marked. I usually use 5 bars and make them 20cm long so that each centimeter is a length of 0.1 units; then kids who want to have an easy way to attempt to draw things to scale.

The object is to control as many bars as you can by shading more than half of the bar in your color.

Players take turns rolling a die (I prefer 10-sided for this and lots of other games, as a way of generating digits).  Or you could draw from a deck of cards labeled 1 through 10 if you like.  Or deal with only having 1 through 6 on a standard die.

Suppose you roll d. Then, you can shade in the area of log(d) in any bar you want where there’s enough unshaded space for it to fit.  Label the space you’ve shaded with “log(d)” so that you remember how much area it’s supposed to take up,  just in case your drawing is not to scale!  If you have now shaded more than half the bar in your color, you circle it as yours and nobody in the future can shade any part of that bar.  If there’s no place that log(d) fits, then you have to pass your turn.

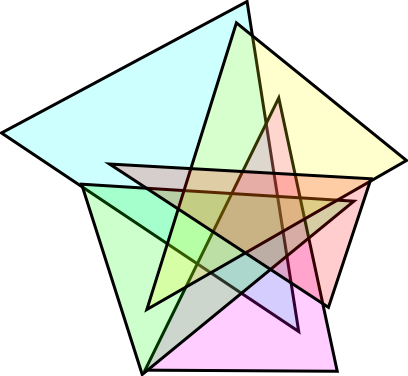
Here’s the start of a game in which the players rolled 3, 6, 5, 2 in that order.  Red shaded 3, then green chose to start a new bar with 6.  Red decided to fight there with the 5, and then green (unwisely in my view) started a new bar again with the 2.

after 3 6 5 2 s

You can let kids shade with pencil — it’s clear enough whose territory it is if they each start from their own side of the board as illustrated here.  Color can be more fun, though!  Also because this is computer-generated it is drawn to scale, which is terrible.  Half the fun of this game is in students shading things to be radically wrong lengths (like, thinking 5 should be halfway to 10 instead of roughly 70% of the way!) and then starting to learn about why 3 is much closer to “halfway between” 1 and 10 in this sense.

The game ends when someone circles the majority of the bars, or when both players agree that there’s no more space for any further shading in any of the bars.

I typically require them to play with no calculators, and do this relatively early in our study of logs, so they don’t know any “rules” yet other than how to go back and forth between exponential and logarithmic form of a statement.  For instance, I’ll have them say “10 squared is 100, the square root of 100 is 10, log base 10 of 100 is 2” and other similar collections, taking them back to fact families from elementary school.

At the very least, this gets them to really understand the joys and sorrows of the fact that log(1) = 0.

My favorite result of this game is when people playing it have an argument, like if in the example above red rolled a 3 next.  Red might want to play in the contested log(5) vs log(6) bar and say “I shade log(3) here, thereby claiming this bar” and the opponent says “you already shaded log(5) and I shaded log(6) so there’s no room to fit log(3) in!” or “no, log(5) and log(3) doesn’t add up to more than half of this bar” (that is, more than log(10) = 1).  The real learning comes from fighting that out and figuring out who is really right!  Then I can pick a few sample fights at the end of the game and have them argue it in front of the whole class so that everyone can become convinced.  It’s hard to play this game without having some kids start to teach you the “log(x) + log(y) = log(xy)” rule, and then you can have them explain their discovery to the rest of the class as a way of speeding up and resolving lots of those arguments.  Then you can let them play again and put their new knowledge to use in strategizing where to shade.  You see a lot more kids reaching stalemates where neither has half the bar and there’s no room left for a log(2) anywhere.

You can also add to the challenge by making them work with bars of other lengths (like 3 instead of 2 — I do recommend integers!) or by having a board with bars of a variety of lengths (where each bar can still count for 1 point, or where longer bars are worth more points).

If you try this out with your students, let me know how it goes and if you have any recommended changes!

Update: Thanks to David Wees for suggesting that I include some images.  I wish I had saved some student work to display but I resorted to making an image by computer.

I’ve been thinking about what to do to update this Multiplication Table activity from the Julia Robinson Math Festival.  I got some good ideas from Steve Wyborney’s blog  — first of all to highlight the distributive property more for younger kids in some easier ways, and also to notice some patterns about the 2×2 squares of numbers. Thanks to Dan Meyer for pointing me to this blog!

I think I’ll spend the next few posts here writing about this activity and seeing what explanations I can add to the JRMF activity.

While I’m at it, let me remind you all about the beautiful idea of drawing the multiplication table to scale: this definitely helps with the noticing of the distributive property at work!  I think it helps with some other features of the table, too.  David Millar made some nice scale drawings of the multiplication table for me.  My favorite use of this drawing is to make it a lot easier to answer the question “What is the sum of all 100 entries in the 10×10 multiplication table?”

Anyone have some further suggestions of problems or patterns to notice in the table?

I have a short parity problem on Numberplay (the NYTimes blog) this week!  Thanks to Gary Antonick for the great image and the opportunity to interact with his fantastic readers.I have some variations in mind, to keep making the problem harder once people finish off this easy beginning. I’m curious what variations you can think of to add to the collection!

Feel free to comment here or there or both.

Thanks to Gary Antonick of Numberplay for inviting me to contribute once more, with a problem on cutting a pizza that is somewhat related to my previous post on dividing the plane.

Rather than give any spoilers for that problem, I’ll offer a few other related problems.

Venn diagrams are traditionally drawn with circles.  With 0 circles, you have 1 region.  With 1 circle, 2 regions.  With 2 circles, 4 regions.  Why do we stop with 3 circles, 8 regions?

I’ve seen some interesting Venn diagrams for 5 sets. Most of them use ellipses:

Five ellipses make a Venn diagram

while others use triangles, while some use …polyominoes?  Let’s see, 5 sets will need 32 regions – is that the most we can make using ellipses?  Using triangles?  Why do I see these diagrams with 5 sets and not with 6 or more?  You can make Venn diagrams with more than 5 sets, but they look pretty weird! Although when colored properly, these Venn diagrams can be quite beautiful.

The next post in this series will answer the questions about how many regions can be created using these various shapes and pose some new ones.  Several of these images are from a great article about symmetric Venn diagrams — I’m more concerned here about counting the number of possible regions, like in the Numberplay column, rather than in ensuring that we have a Venn diagram (where every possible intersection of sets exists exactly once).

As an opening multiplication table question: add up the 100 numbers that you’d find in a typical classroom-style 10 by 10 multiplication table. How did you do it?

I commonly see the wrong answer of 5050, which students get by adding up the numbers 1 through 100, or by assuming that the general method of “how many numbers, times average of first and last” will work for any collection of numbers.

The successful solvers use some more flexible strategies.  I see them summing the first row to get 55, then summing the second row to get 110, and so on.  Take the big problem and break it into 10 easier subproblems.  Each row is easy to sum because it actually is an arithmetic sequence, so 10 times the average of first and last works pretty quickly for each row, and now you have 10 numbers to sum.

But wait!  Those 10 numbers are themselves an arithmetic progression, so they’re easy to add up, too.  That should make students wonder if there’s a reason for that!  If it doesn’t, that seems like an important problem solving skill to learn — take it seriously when people tell you to reflect on the problem and solution after you get the answer!  (I find it ironic that after the Wikipedia article on How to Solve It mentions that the first of Polya’s four phases is neglected, it proceeds to shortchange the the fourth phase.  Polya recommends several useful subcategories to help you “look back” productively.)  I encourage students to give a guess at the beginning, and then to compare their guess to their final result and think about how they could guess better next time.  I also recommend that they imagine the sentence they would like to send back in time to themselves at the start of the problem, as a way of getting them to summarize the key step that they had the hardest time seeing.

At some point through this process, someone eventually figures out that your rows are 1 times the first row, 2 times the first row, 3 times the first row, and so on.  The distributive property strikes again!

What really opens up the thinking, though, is when you look at the multiplication table (and the distributive property) visually or geometrically instead of numerically.  Avery wrote a short blog post that mentioned this way of drawing the multiplication table after attending our summer math teachers’ circle workshop in Berkeley.  My friend David Millar brought his graphic design skills to work and now we have some beautiful versions of this multiplication table that you can use in the classroom!

There’s a lot more problem-solving fun to be had with the multiplication table, though, but we’ll have to save some of those questions for future posts.  In the meantime, how does the multiplication table relate to the area and perimeter questions from Dan Meyer’s blog?  (Does it relate to this more interesting question, too?  Maybe not as strongly.)  For some of the future multiplication table posts, you can get a preview with this Julia Robinson Mathematics Festival activity and especially the T-shirt design relating Pascal’s triangle to the multiplication table.

Several years ago, I think in 2002, there was a Mandelbrot contest problem that asked for the largest number of regions in the plane that could be generated by two triangles.  The answer turns out to be 8, and it’s interesting to think about why there can’t be more.

Naturally, this got me wondering about the integer sequence: what is the largest number of regions in the plane you can generate using two n-gons?  At first this problem seems very simple: 8, 10, 12, 14, …

But after a little while, I realized it went 8, 18, ?, 38, ?, …, where the number of regions for two 2n-gons is easy to compute.  You can probably figure out what I was assuming that wasn’t actually a requirement.

For odd numbers of sides, things are much more complicated.  In fact, to this day I’m still not sure of the answer.  I have a drawing that I think gives the maximum number of regions, but I haven’t been able to prove that there isn’t a better drawing out there somewhere.  Anyone have any ideas for me?

Problems like this one are appealing to me because they are easy to play with but hard to finish.  There are more elementary ones (like regions created by lines), classics (like regions in space determined by planes, as in Polya’s famous video), interesting side notes (ever wonder why we only draw Venn diagrams with 3 circles and not with 4?  Have you seen diagrams with 4 sets — and noticed that they don’t use circles?), and difficult ones like the case of two odd-sided polygons.

Maybe this would make a good topic for a future Numberplay column.

Symmetry is often thought of as something that applies to geometry, but of course it can be found in algebra or even probability.

The 2007 AMC8 gave us a deck of cards with a red A, B, C, D and a green A, B, C, D, and winning hands of two cards were two of the same color or two of the same letter.

What is the probability of a winning hand?

We can do this problem the hard way: there are 8 choose 2 = 28 hands, there are 4 choose 2 = 6 red pairs, 4 choose 2 = 6 green pairs, and 4 same-letter pairs, so that makes 16/28 = 4/7.

But we can also use symmetry.  Your first card can be anything.  Whatever it is, there are 3 cards of the same color and 1 of the same letter out of the remaining 7 cards, so you have a 4/7 chance of winning on your second pick.  Because the given cards and the rules for winning don’t distinguish between the two colors or the four letters, every first card has this same chance of winning.  That’s symmetry!


Yesterday was Halloween at the San Francisco math circle, and our current theme there is set theory.  So we worked on the problem of assigning infinitely many candy bars, numbered 1, 2, 3, and so on, to infinitely many people, who were conveniently dressed in costumes with the same list of numbers.  That’s an easy start: give candy bar number 1 to person wearing costume 1, and so on.

Now what do you do when one more person shows up wearing costume number 0?

The usual answer is that person 1 hands their candy bar to 0, and person 2 hands their candy bar to 1, and so on.  There are plenty of “lateral thinking” kinds of answers you’ll get from students, like everyone donating a microscopic crumb of their candy bar to make one for the new person (which, of course, would create much too big of a bar when you’re done!).  But these sixth graders came up with their own take on this idea: person 10 hands their bar to person 0, person 110 hands theirs to person 10, and so on.  Now we see how we can do this without making everyone swap candy bars!  In fact it’s “exponentially few” instead of the usual linear solution.

Then we wondered what might happen if there was another infinite party at my neighbor’s house across the street.  Conveniently, they also had one person in costume for each positive integer.  But they had a big problem: the first party’s purchase of infinitely many candy bars left all the store shelves empty. What are they going to do?

Eventually, with a lot more leading than I had hoped to do, we arrived at the idea of passing out the candy bars so that if the people are numbered like this:

 Party 1:  1  2  3  4  5  6  7  8  9 ...
 Party 2:  1  2  3  4  5  6  7  8  9 ...

then we could assign the candy bars like this:

 Party 1:  1  3  5  7  9 11 13 15 17 ...
 Party 2:  2  4  6  8 10 12 14 16 18 ...

But what if there aren’t just two parties, but infinitely many?  The houses on my street are also numbered 1, 2, 3, …

I think the usual solution to that problem is to pass out the candy bars “diagonally”, like this:

 Party 1:  1  3  6  10  15 ...
 Party 2:  2  5  9  14 ...
 Party 3:  4  8 13 ...
 Party 4:  7 12 ...
 Party 5: 11 ...

But my students had a better idea.  They wanted to repeat the process that you use for 2 parties.  Now, I had some concerns about this.  For instance, if you try to accommodate the second infinite party by repeating the process we used when person 0 showed up, it won’t work out very well.  If you repeat that process infinitely many times, there isn’t a number to tell you which candy bar you’ll end up with when it’s all done.  But one sixth grader told me that we could use this process to combine party 1 and 2, and then 2 and 3, and then 3 and 4, and so on, and that way nobody would have to wait infinitely many steps to get their proper candy bar.  After thinking about it for a little while, I was convinced that she was correct.  We would start out with party 1 and party 2 as above, with the odd and even numbers, and then the even numbers in turn would get split among party 2 and party 3, with party 3 getting the multiples of four, and then those would in turn be shared between party 3 and party 4, and so on. We end up with this:

 Party 1:  1  3  5  7  9 ...
 Party 2:  2  6 10 14 ...
 Party 3:  4 12 20 ...
 Party 4:  8 24 ...
 Party 5: 16 ...

and now you can see that at the top of each column we have the odd numbers, and then we double the number for each step down, so no matter what costume you’re wearing and what party you’re at, you can figure out what candy bar you get.  And, knowing what power of 2 divides your candy bar number, and what odd number is left after dividing it out, we can figure out exactly who you are and which party you’re attending.  So, each person gets one candy bar, and everyone is happy.  Also, this turns out to be an “exponential” solution instead of the usual “quadratic” one.  Is the quadratic really simpler?  I certainly could write down a formula for the candy bar number for person #k at party #n much more easily with this exponential situation than I could in the quadratic (diagonal) one.

Of course, after finding this I wondered if it was already well-known, and maybe it’s not as a solution to the Cantor problem.  I think her idea, iterating the solution for two parties instead of coming up with something new for the infinite case, is brilliant and much more intuitive to understand than the usual diagonal trick.  This arrangement of the integers is already known: among other things, it’s in the Encyclopedia of Integer Sequences. But this particular application of it is still pretty nice!

By the way, since this is my first post, you might want to visit the about page for this blog.  Let me know if you have any suggestions for design, layout, theme, or any of that; I don’t know much about graphic design.  I also welcome any interesting math problems you might be interested in having me write about. And, welcome!